Seeing data in new ways
Developing an interactive tool on real estate trends in Metro Vancouver
Four MEL students used Tableau to develop an interactive tool on real estate trends in Metro Vancouver – and they’re excited about the opportunities to put their new data analysis and visualization skills to work.

Knowing how to work with large data sets – and being able to clearly present that data to decision-makers – is a valuable skill for engineering leaders.
In the course “Analytics & interpretation for applied sciences,” students in the Master of Engineering Leadership (MEL) program are introduced to big data and predictive analytics, and they learn how to use Tableau software to design interactive visualizations and dashboards. The final project for the course asks students to work with real-world data sets and then use Tableau to create an interactive tool that brings the data to life.
When “Team 9” first came together to work on the project, they began by talking about their interests to find a topic that would resonate with each of them. Team members were Sue Arongna (High Performance Buildings), Maxim Borzenkov (Dependable Software Systems), Chris Cho (High Performance Buildings) and Dusyant Kumar (Clean Energy Engineering). They soon discovered that they were all interested in purchasing a home – either for themselves or as an investment.
And as prospective purchasers, they all had the same questions: Is now a good time to buy property in Metro Vancouver? Are we in a housing bubble? Could prices continue going up? What’s the impact of demographic trends on home values over time?
Realizing that there was no publicly available data source to conveniently answer all of these questions, the group knew they had their topic.
“We reached out to Brendon Ogmundson, chief economist for the BC Real Estate Association, to explain our goals, ask if he was willing to sponsor our project and see if he could provide us with data from his organization,” says Sue.
“He was really excited by our idea, saying how useful it would be to bring together information from multiple data sets.”
The four students narrowed their focus to home sales in the six most sought-after areas of Metro Vancouver over the past decade. They combined market data from the BC Real Estate Association with population data from BC Stats and mortgage-rate data from StatCan from 2010 to 2020.
Maxim took the lead on preparing and cleaning the data and converting it to a usable format within Tableau’s relational database. They also created a GeoJSON file so that the data could be displayed for the six key Metro Vancouver communities.
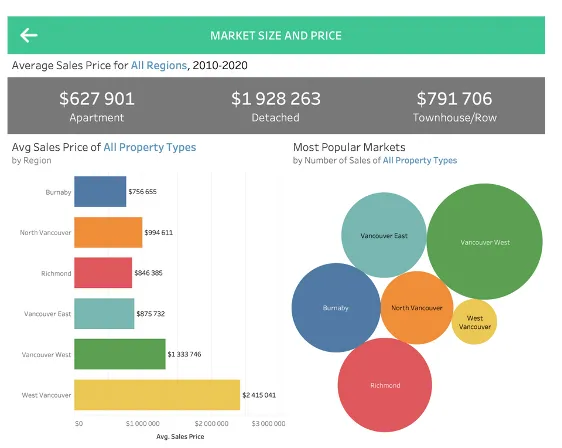
In addition to contributing to overall project tasks and deliverables, each student was responsible for researching a specific area based on their interests. Chris covered demographics, Sue examined factors that influenced house prices over the time period, Dusyant looked into market size and price, and Maxim explored market temperature (the supply/demand balance).
They then developed six interactive dashboards that would enable users to drill down to understand the connections between house type (detached, townhome or apartment), average sales price, location, demographics and shifting supply/demand levels.
The interactive tool they created empowers those wanting to purchase a home for themselves or as an investment to conduct extensive research and make decisions with more confidence.
Their key takeaway? The title of their project – “Happy homes come with a cost” – acknowledges that real estate in the Vancouver area is expensive.
“Our research shows that while prices do fluctuate, the ultimate trajectory is up,” says Dusyant. “That means the right time to buy is right now – and the sooner the better.”
Applying data visualization skills
While the students say that they are not interested in careers in real estate (yet!), they all acknowledge that the skills they learned through this project are practical and relevant.
“As a software engineer, I rarely use charts in my work,” says Maxim. “The most useful aspect of this project for me was working with data and learning how to present it visually.”
Says Dusyant: “I hadn’t used Tableau at all before this course. But I can see opportunities to apply it in many areas, and in fact I recently used it in a report where I was conducting a life-cycle analysis.”
“It’s very helpful to use data visualization to communicate key ideas.”
With his background on the project management side of building construction, Chris sees ways that Tableau could help people make complex decisions.
“I’m thinking about the construction bid process, which is incredibly data-heavy,” he says. “Tableau makes it very easy to clean up data and present it to the customer or owner in a way that helps them better understand the next steps or the implications of certain decisions.”
“It’s not just knowing how to use Tableau that’s valuable,” says Sue.
“It’s understanding how big data can be used in your industry. For me, in the high-performance building sector, I’m thinking about ways to use this knowledge to address issues of construction waste, perhaps by creating a platform that tracks material that can be reused – like timber and concrete – and connecting to others who can use that material, so that we keep it out of the waste stream.”
Beyond their new skills in data analysis and visualization, team members say they learned a lot in the course about collaboration, communication and effective team work. And, as potential homebuyers, the four now have a powerful new tool to help them make informed real estate purchasing decisions in Metro Vancouver.